Retail product mix

What sells where.

Ten bouquets, three markets. A product mix dashboard with the photo of every bouquet next to its numbers, from the markets down to each store.

Data
Floraya commercial orders
Pages
Market & mix and Product explorer
Visuals
6 charts, 5 KPIs, 1 extension
Default view
Completed orders, 2026

A quick tour

Both pages

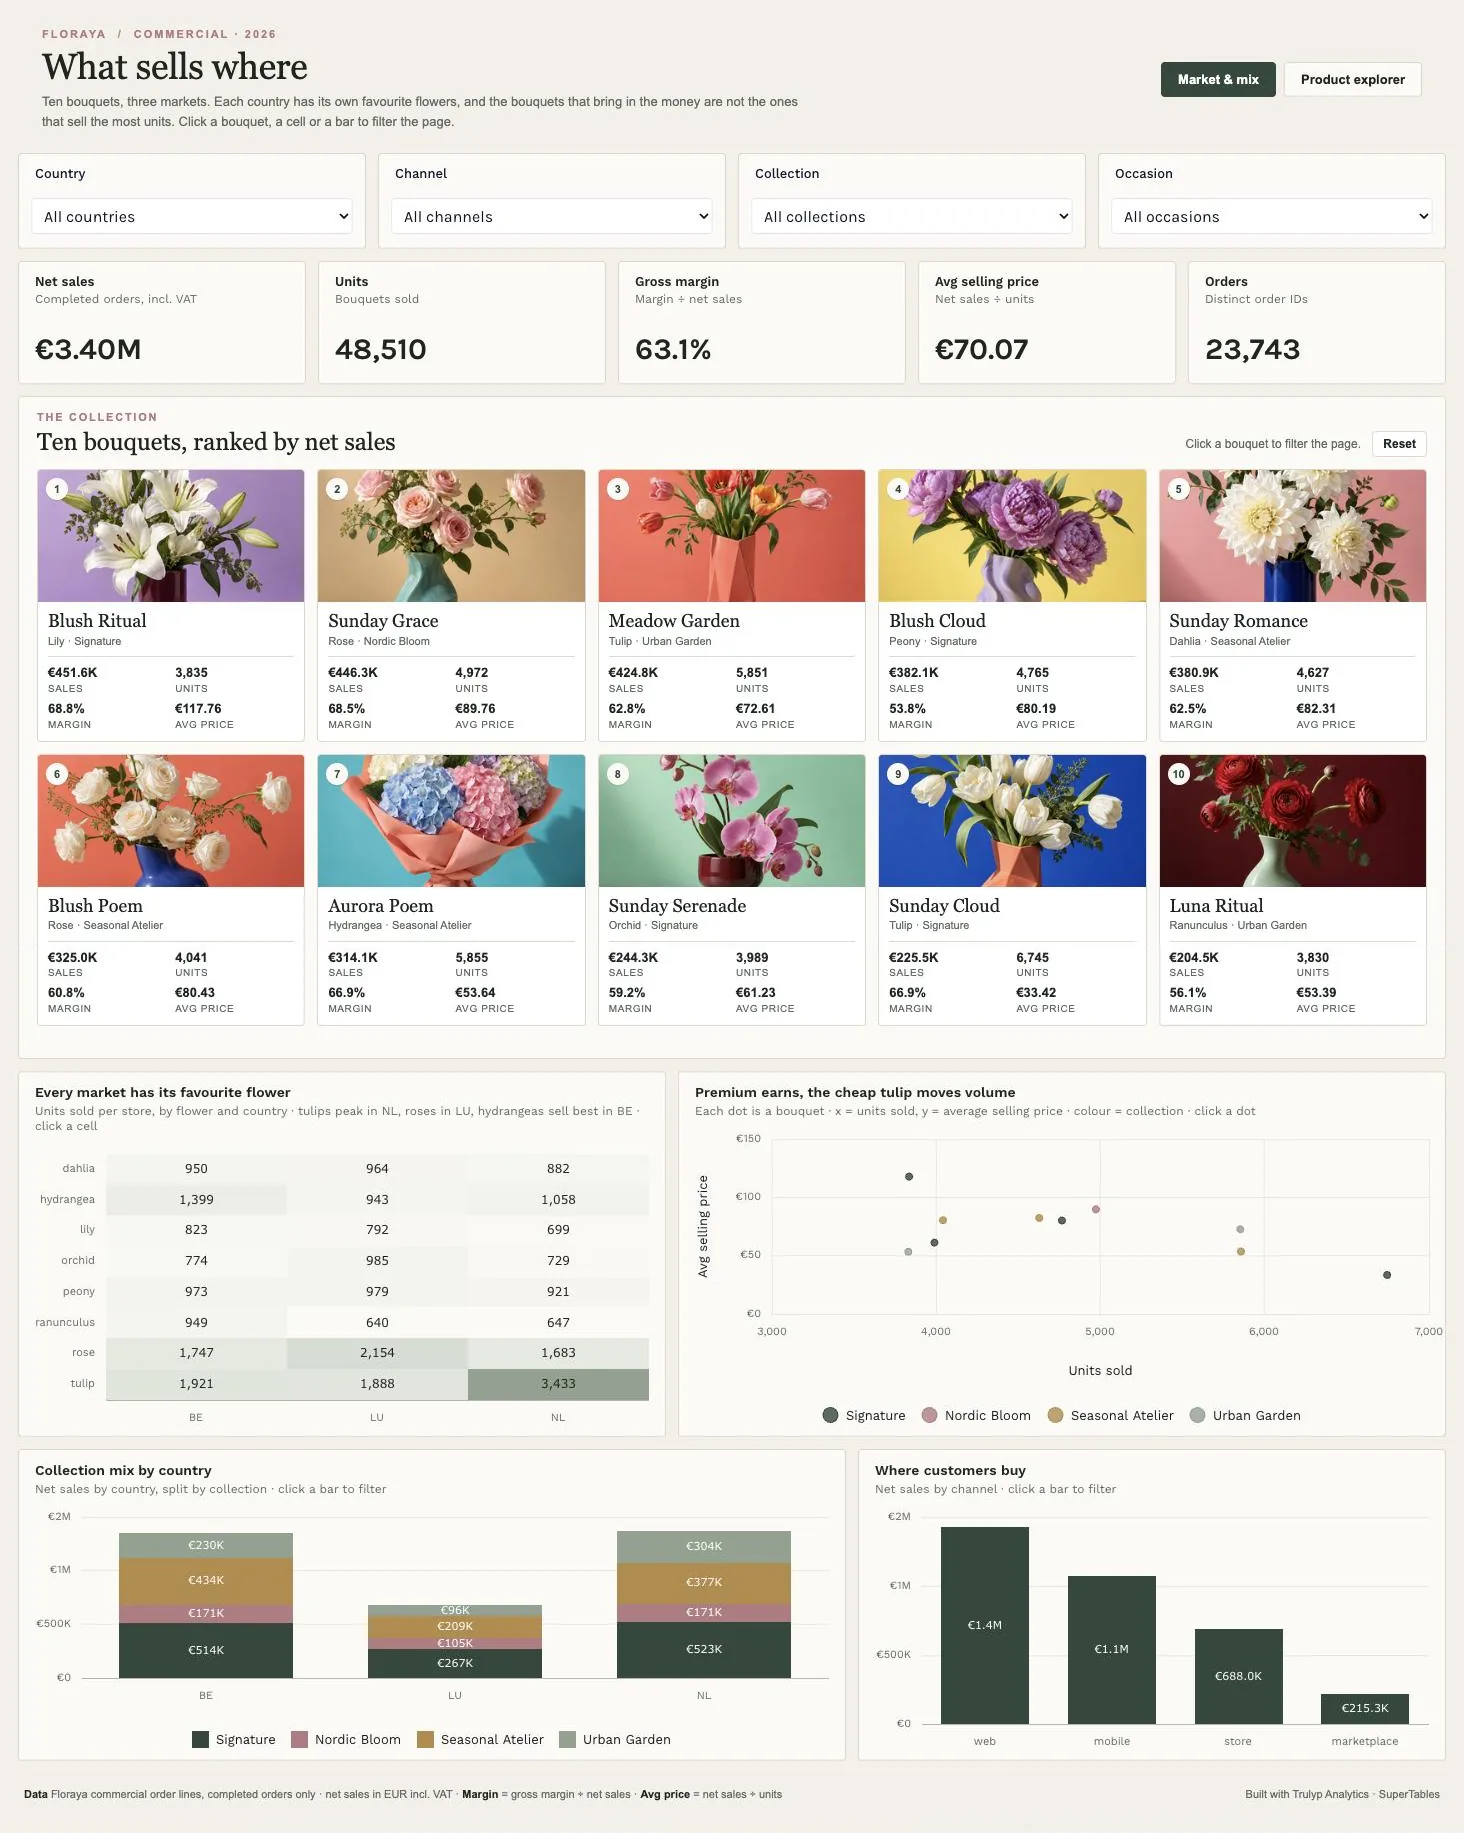
The full Market & mix page: header, filters, KPIs, the bouquet gallery, a flower-by-country heatmap, a price-versus-volume scatter and two bar charts

Built in Trulyp Analytics on Floraya commercial orders (demo data). Click the screenshot to open it at full size.

The thinking behind it

Show the product, not just its name.

A product range is easy to list and hard to judge. Which bouquets pay the bills, which ones only move volume, and does every market want the same thing? This dashboard answers that for a florist with ten bouquets, five stores and three countries.

People recognise products faster than product names, so the photo of each bouquet sits next to its numbers: in the gallery, in the ranked list on the second page and in every row of the table. Every bouquet, cell and bar filters the page.

  1. How big is the business?

    Five headline numbers: net sales, units, gross margin, average selling price and orders, all for completed orders only.

  2. Which bouquets carry the range?

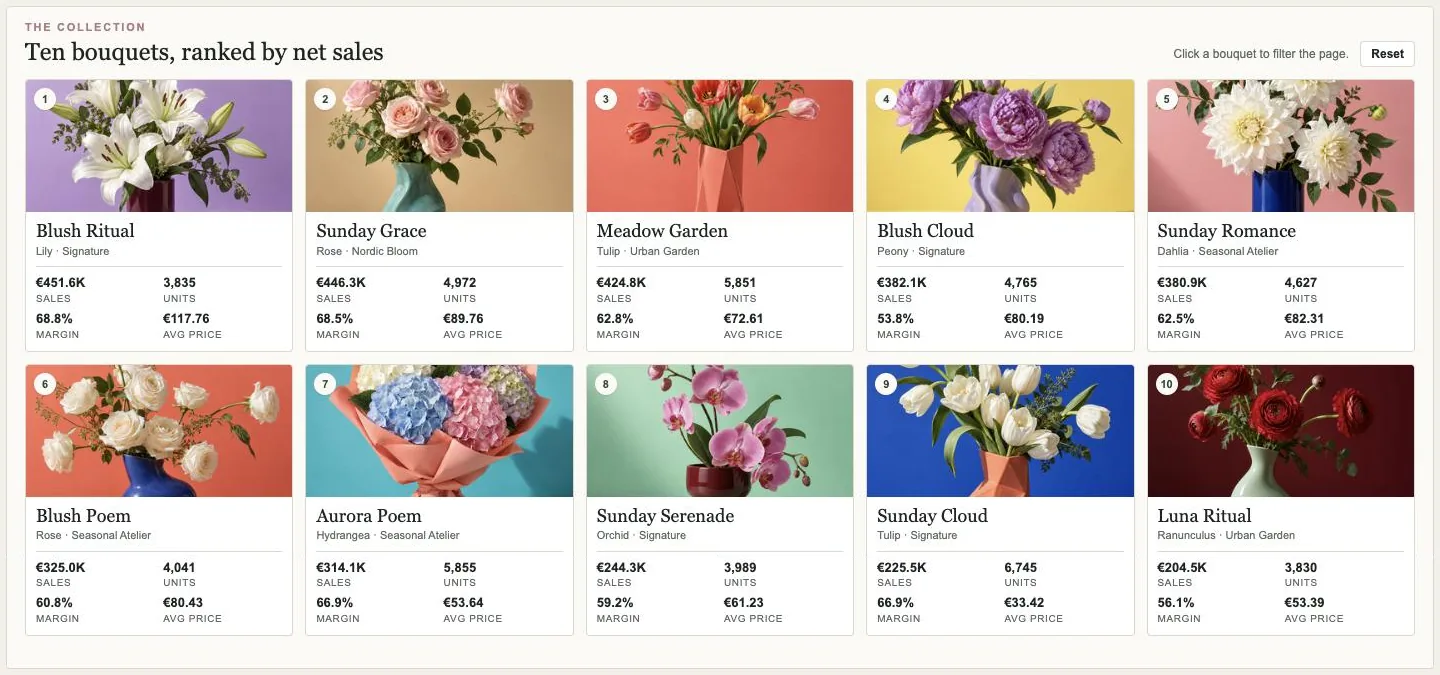
    A gallery ranks the ten bouquets by net sales, with photo, flower, collection, units, margin and average price on each card.

  3. Does every market want the same?

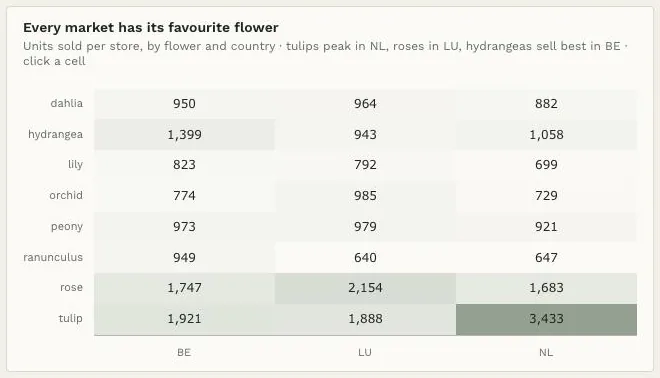
    A heatmap of units per store by flower and country shows the local favourites, and a stacked bar shows the collection mix per country.

  4. Where is the detail?

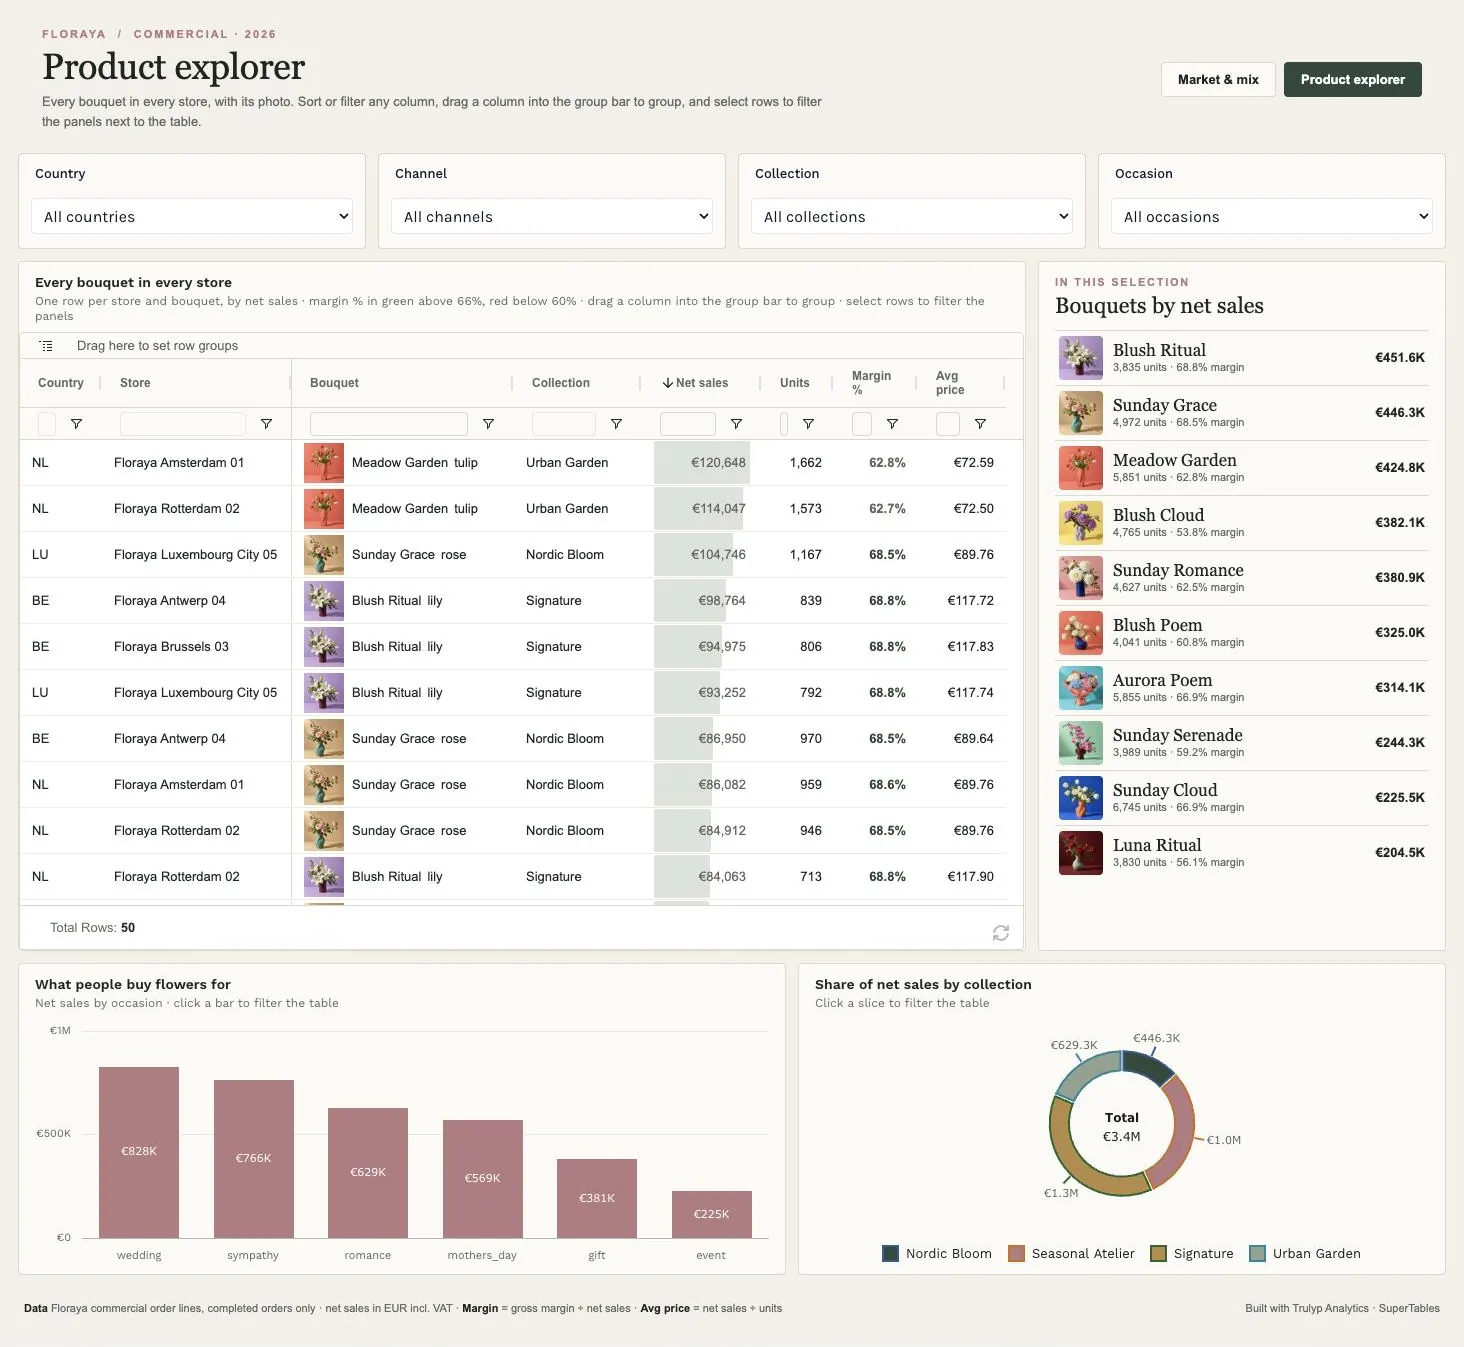
    The Product explorer lists every bouquet in every store, with its photo, and keeps a ranked photo list of the current selection next to it.

What it tells a florist

Range, price and place.

For a florist the real question is not how much was sold, but what belongs on the shelf, at what price, and where. The 2026 demo data gives four answers.

  • €3.40Mnet sales from 48,510 bouquets
  • 1.8×tulips per store in NL compared with BE and LU
  • 73%of net sales through web and mobile
  • 53.8%thinnest margin: Blush Cloud
  • Know what earns and what moves

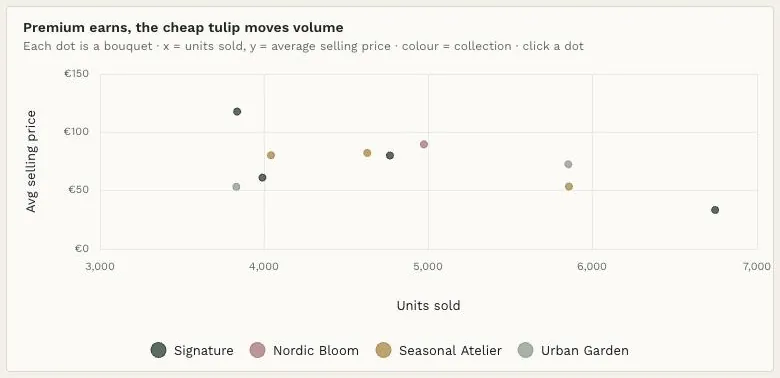
    Blush Ritual brings in €451.6K at €117.76 a bouquet. Sunday Cloud sells the most units, 6,745, but at €33.42 each it earns half as much. Both matter, for different reasons.

  • Stock for the local taste

    Per store, the Netherlands sells 3,433 tulip bouquets against about 1,900 in Belgium and Luxembourg. Luxembourg sells the most roses per store, Belgium the most hydrangeas. One assortment does not fit all.

  • Watch the margin, not just the sales

    Blush Cloud is the fourth best seller at €382.1K but has the thinnest margin, 53.8%, against 68.8% for Blush Ritual. That is a pricing or sourcing conversation.

  • See the store behind the number

    A number on the first page is one click away from the stores behind it: the Product explorer lists each bouquet per store, photo included.

Element by element

From the market to the shelf.

Start with the totals, meet the ten bouquets, then see how each market differs. The Product explorer takes any bouquet down to the individual store.

Country, Channel, Collection and Occasion filters above five KPI cards: €3.40M net sales, 48,510 units, 63.1% gross margin, €70.07 average price and 23,743 orders

01

Start with the totals

Country, channel, collection and occasion filters sit above five headline numbers. A locked filter keeps every number on completed orders, so returned and cancelled lines never inflate the totals.

  • Filters
  • KPI visuals
  • Calculations
A gallery of ten bouquet cards with photos, from Blush Ritual at €451.6K to Luna Ritual at €204.5K

02

Meet the collection

Ten bouquets ranked by net sales, each with its photo, flower, collection, units, margin and average price. Click a bouquet and the whole page filters to it.

  • HTML visual
  • Product thumbnails
Heatmap of units sold per store by flower and country, with tulips in the Netherlands as the darkest cell at 3,433

03

Find the local favourites

Units sold per store, by flower and country, so a market with one store compares fairly with markets that have two. Tulips peak in the Netherlands, roses in Luxembourg, and hydrangeas sell best in Belgium.

  • Heatmap
  • Calculation
Scatter plot of ten bouquets, units sold against average selling price, coloured by collection

04

Price against volume

Each dot is a bouquet: units sold across, average selling price up, colour by collection. The premium lily sits top left, the cheap tulip far right.

  • Scatter plot
  • Calculation
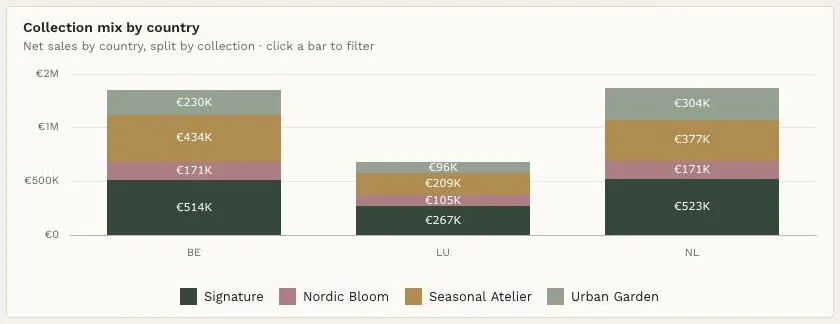
Stacked bar chart of net sales per country split by collection: Signature, Nordic Bloom, Seasonal Atelier and Urban Garden

05

Compare the markets

Net sales per country split by collection, next to the channel mix. Web and mobile bring in 73% of net sales; the stores bring in a fifth.

  • Stacked bar chart
  • Bar chart
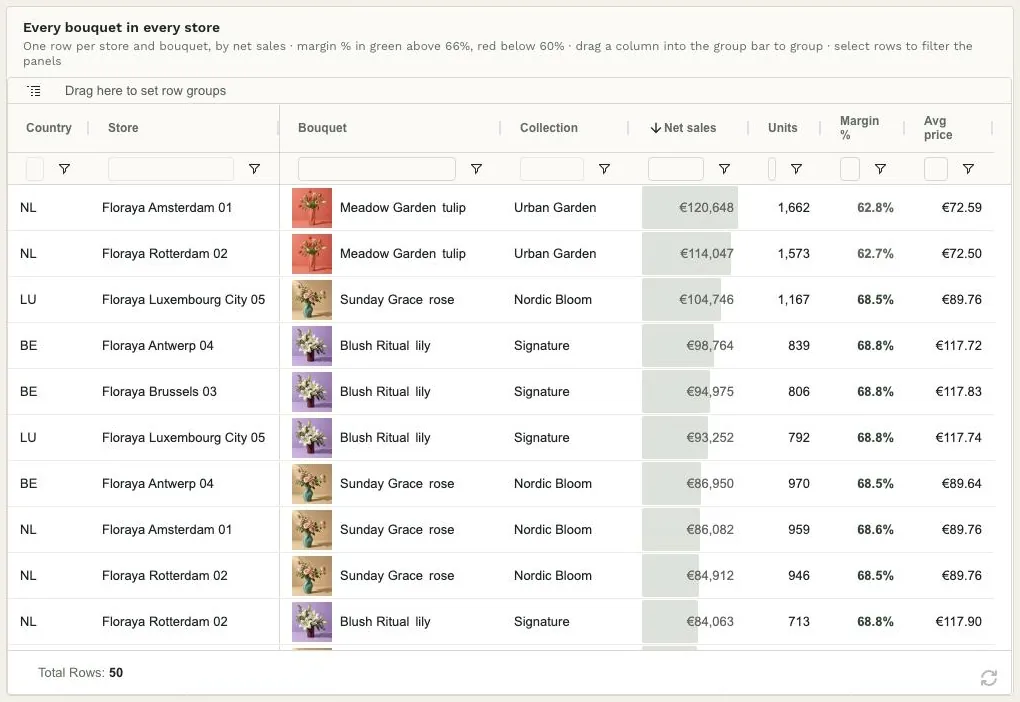
SuperTables grid with one row per store and bouquet, each with a bouquet photo, collection, net sales bar, units, margin and average price

06

Go down to the store

The Product explorer lists every bouquet in every store with its photo, net sales bars, margin and average price. Select rows to filter the ranked photo list and the charts next to it.

  • SuperTables
  • HTML visual
  • Bar chart
  • Donut chart

Under the hood

Five steps to rebuild it.

No custom code: one data source, a locked filter and two HTML visuals do most of the work.

  1. Start from the order lines

    Pick the Floraya commercial data source. Its order lines already carry a thumbnail URL for every bouquet, which the HTML visuals and SuperTables show as images.

  2. Count only completed orders

    A locked global filter on order status keeps returned and cancelled lines out of every visual, so each chart can use plain sums.

  3. Calculate rates from sums

    Margin, average selling price and units per store are calculations over sums, never averages of row-level rates. Units per store lets a one-store market compare fairly with two-store markets.

    SUM([quantity]) / COUNTD([store_id])
  4. Show the products

    Two HTML visuals use the thumbnail field: a gallery of cards on the first page and a ranked list on the second. In SuperTables, a combined column puts the photo next to the bouquet name.

  5. Let every click filter

    Each bouquet card, heatmap cell and bar works as a filter. Pick its targets per visual, so a click on one market or bouquet narrows the whole page.

Put your own products on the page.

Photos, prices and margins side by side, straight from the data you already have.