Financial planning

From owner input to group P&L.

A rolling 12-month forecast where 24 cost-centre owners type their numbers into one grid, and the consolidated P&L and cash runway update from the same data.

Data
Helvara Group forecast (demo)
Pages
4 input pages and Group P&L
Horizon
Oct 2026 to Sep 2027
Currency
CHF

From owner to finance in a few clicks

Input and outcome

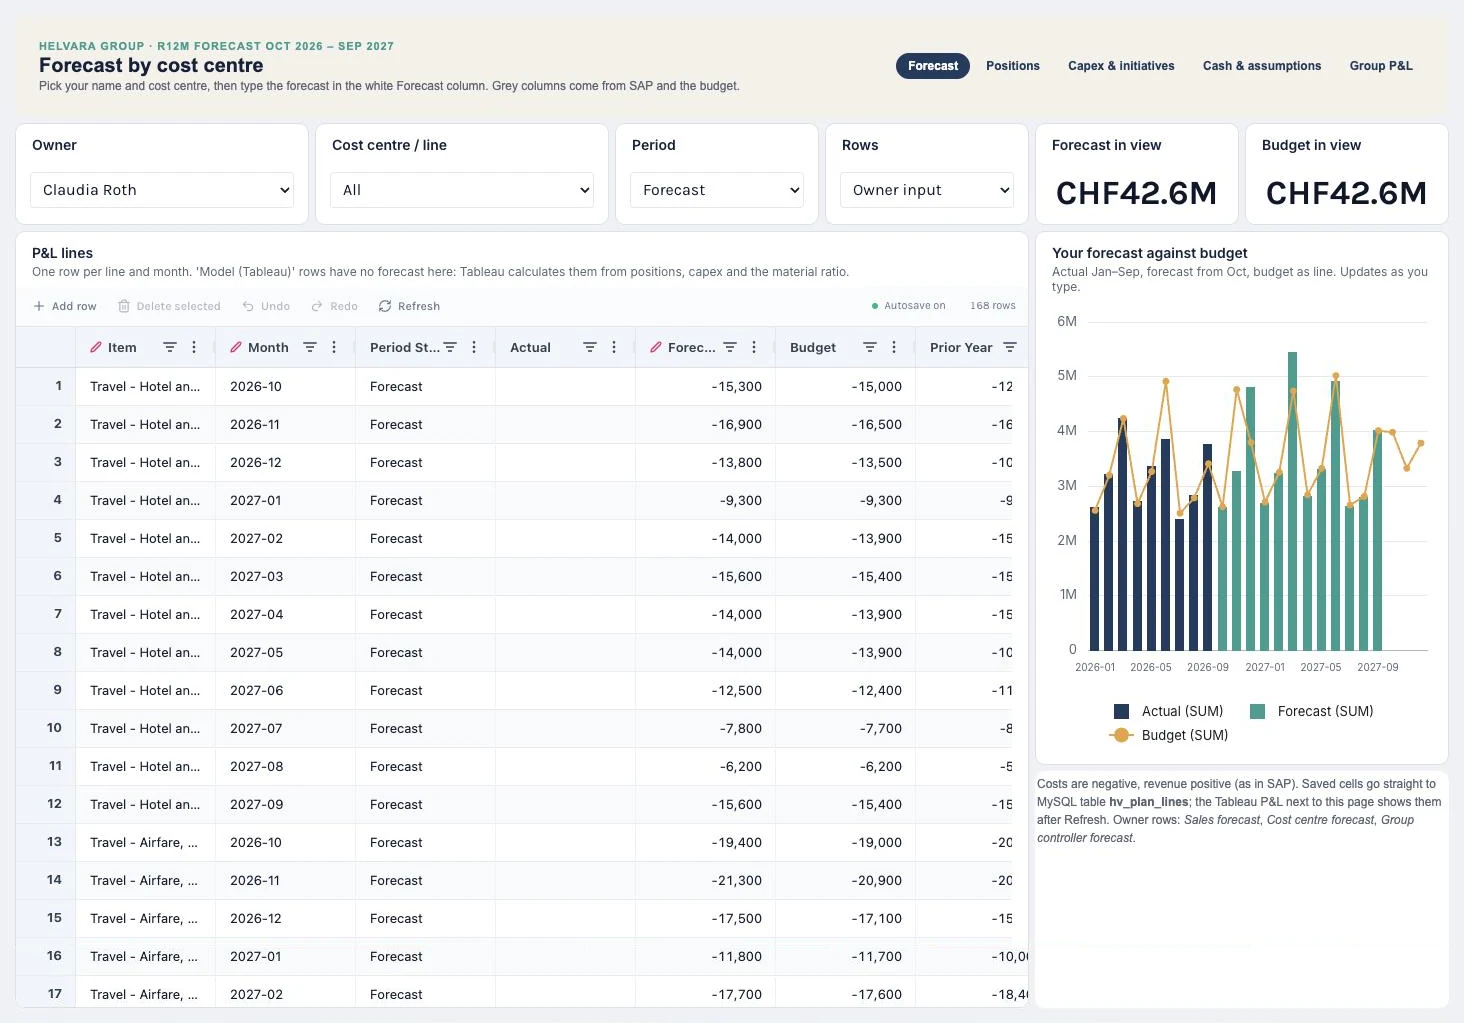
The full Forecast page: header with page buttons, owner and period filters, two KPI tiles, the editable P&L lines grid and a forecast-versus-budget chart

Built in Trulyp Analytics on Helvara Group forecast (demo data): writeback tables and a Tableau semantic model. Click the screenshot to open it at full size.

The planning problem

No more forecasts by email.

A rolling forecast usually travels by email: a spreadsheet per cost centre goes out, comes back in different shapes, and someone in group finance spends days copying numbers into the consolidation. By the time the P&L is ready, the numbers are old.

Here every owner types into the same grid, filtered to their own lines. Saved cells go straight to a database table. Positions, capex projects and cash items have their own pages. The Group P&L page reads the same tables through a Tableau model, so the consolidated view is one click away from the input.

  1. What do I still need to forecast?

    Pick your name and you see only your lines and months, with actuals, budget and prior year next to the editable Forecast column.

  2. Am I above or below budget?

    A chart next to the grid shows actual months, your forecast and the budget line, and two tiles total what is in view.

  3. What does it mean for the group?

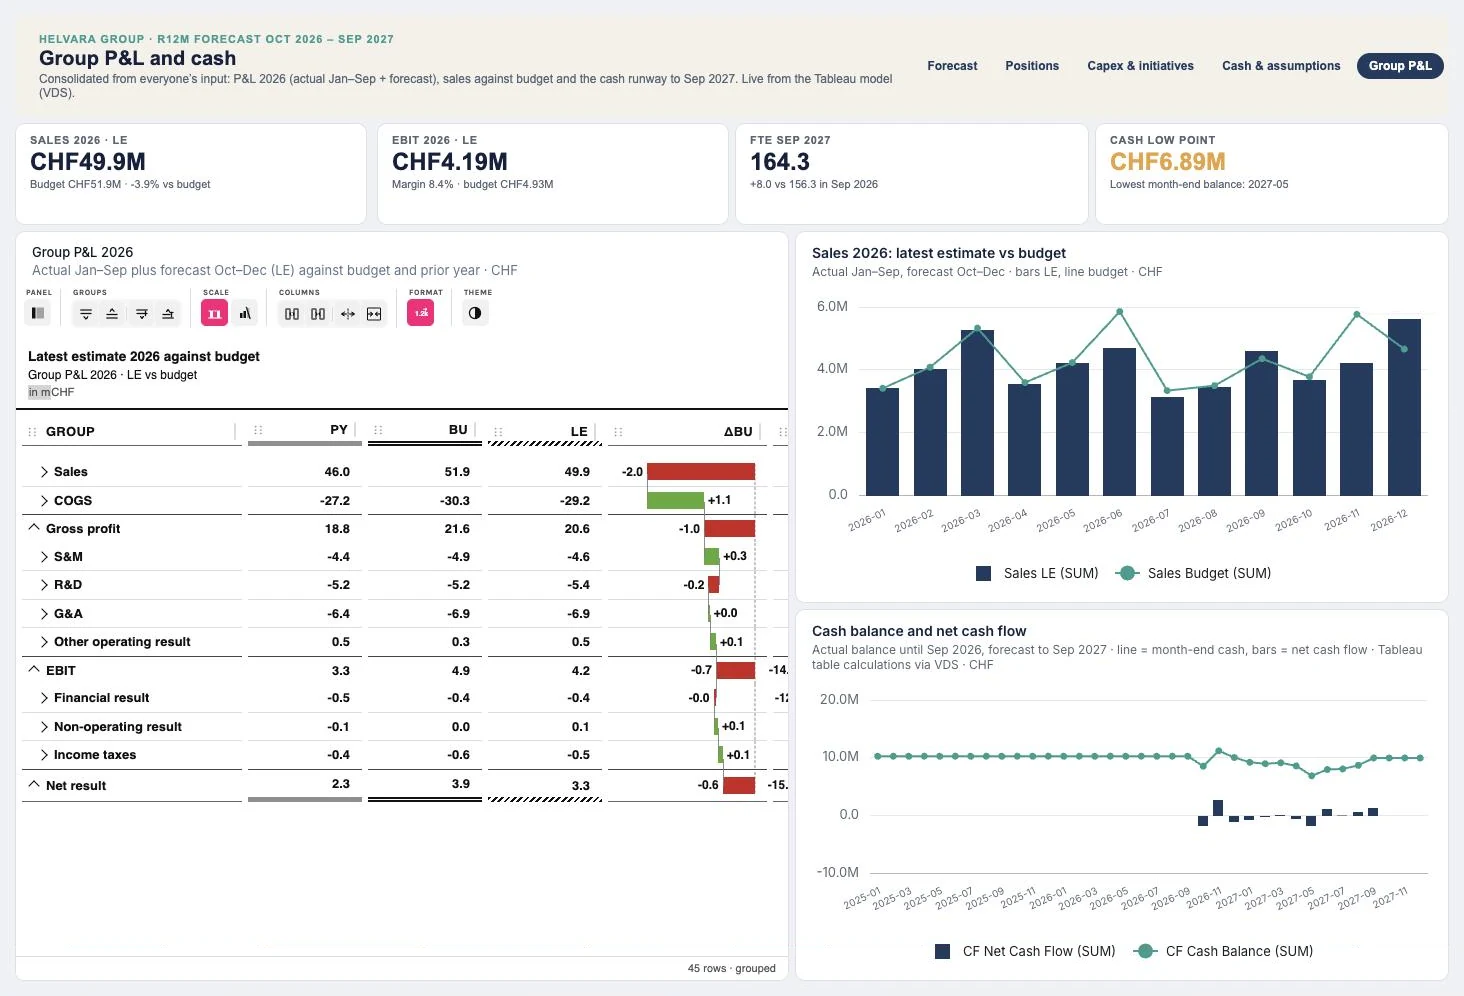
    Sales and EBIT for 2026 against budget, the FTE plan and the lowest cash balance in the next twelve months, on one page.

  4. Where does the gap come from?

    A P&L in the IBCS style with subtotals and variance bars, expandable from section to line.

What finance gets

One set of numbers.

Planning and reporting share one set of tables, so nobody consolidates by hand. In the demo data the Group P&L shows this as soon as the owners are done.

  • CHF 49.9Msales 2026, 3.9% below budget
  • 8.4%EBIT margin, against 9.5% in the budget
  • +8.0FTE by Sep 2027
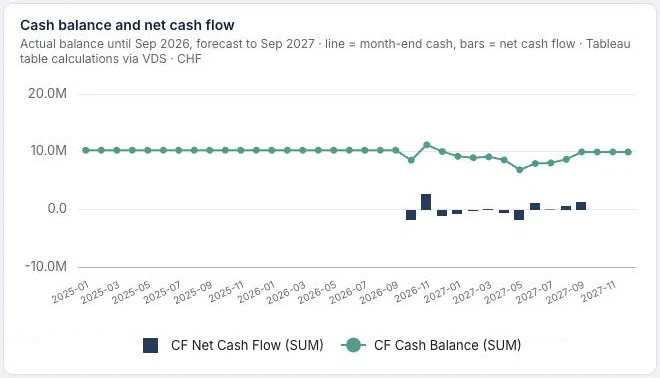
  • CHF 6.89Mlowest cash balance, May 2027
  • One grid for everyone

    Owners see only their own lines. Actual months are filled from SAP and the budget, the Forecast column is the only thing they type, and every cell is saved as they go.

  • People and projects, not just numbers

    Positions, start and end months, FTE and salaries feed personnel cost. Capex projects with go-live dates feed depreciation and cash-out. Change a date and the P&L follows.

  • See the gap early

    Sales for 2026 land at CHF 49.9M against a CHF 51.9M budget. EBIT is CHF 4.19M against CHF 4.93M, mostly from the sales shortfall, partly offset by lower cost of sales.

  • Keep an eye on cash

    The running cash balance comes from Tableau table calculations on working capital, capex and cash items. The low point, CHF 6.89M in May 2027, is on the page before anyone asks.

Page by page

Five pages, one forecast.

Four input pages for the owners and one page for group finance. A row of buttons in every header moves between them.

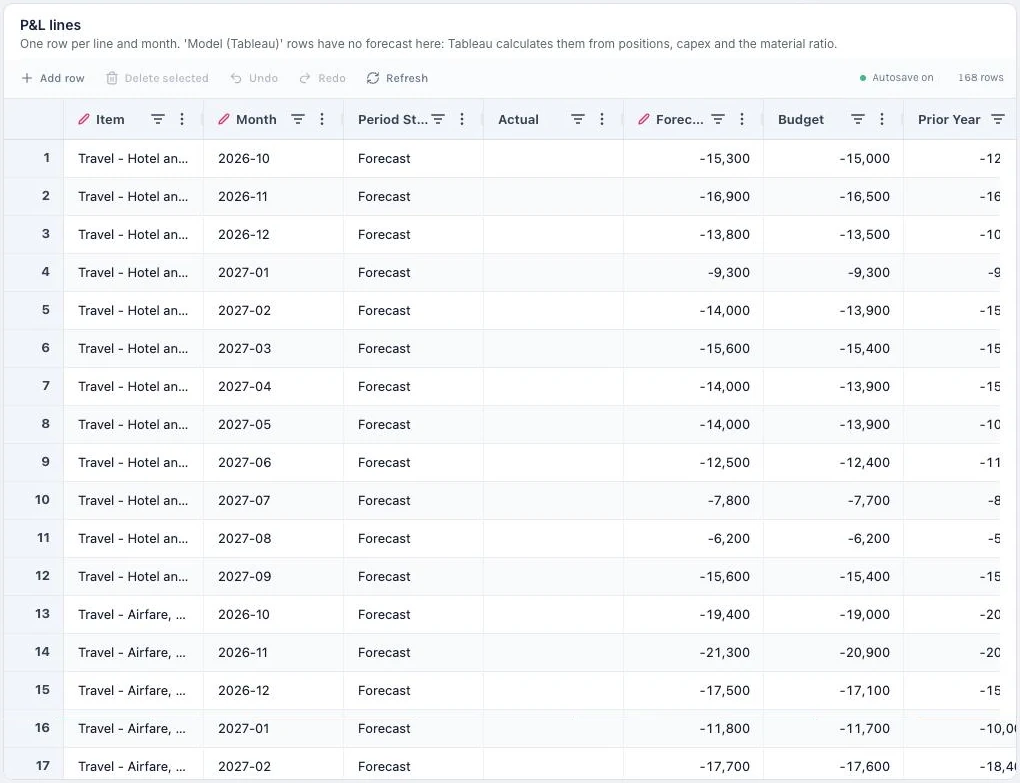
Spreadsheet of P&L lines with item, month, period status, actual, forecast, budget and prior year columns

01

Type the forecast

Pick your name and the grid shows your P&L lines for the forecast months. Item and month are fixed, actuals and budget are reference columns, and the Forecast column is where you type. Saved cells go straight to the database.

  • Spreadsheet
  • Writeback
  • Filters
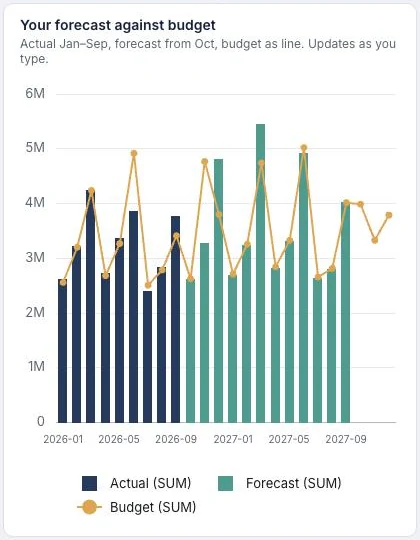
Bar and line chart of actual, forecast and budget per month for the selected owner

02

Check it against budget

Next to the grid, actual months as dark bars, forecast months in teal and the budget as a line. It reads from the grid itself, so it moves as you type.

  • Bar and line chart
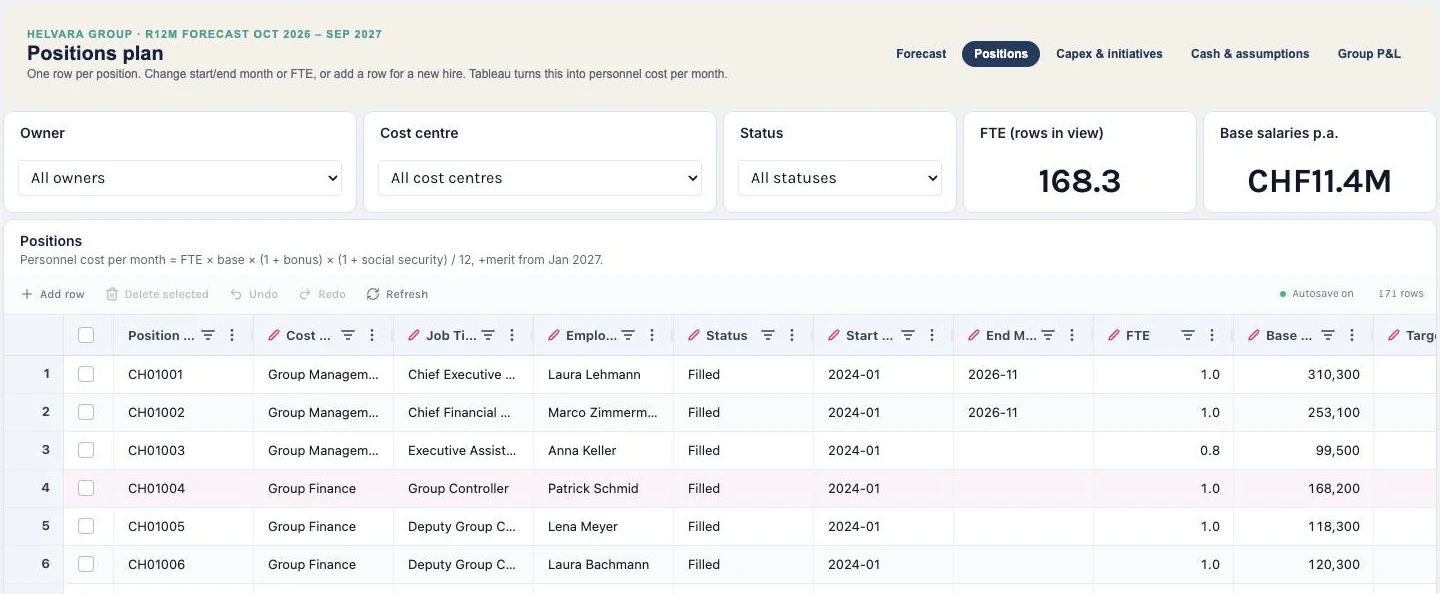
Positions spreadsheet with filters for owner, cost centre and status, and tiles for FTE and base salaries

03

Plan the people

One row per position, with cost centre, job title, status, start and end month, FTE and base salary. Add a row for a new hire, and personnel cost per month follows from FTE, salary, bonus and social security.

  • Spreadsheet
  • Writeback
  • KPI visuals
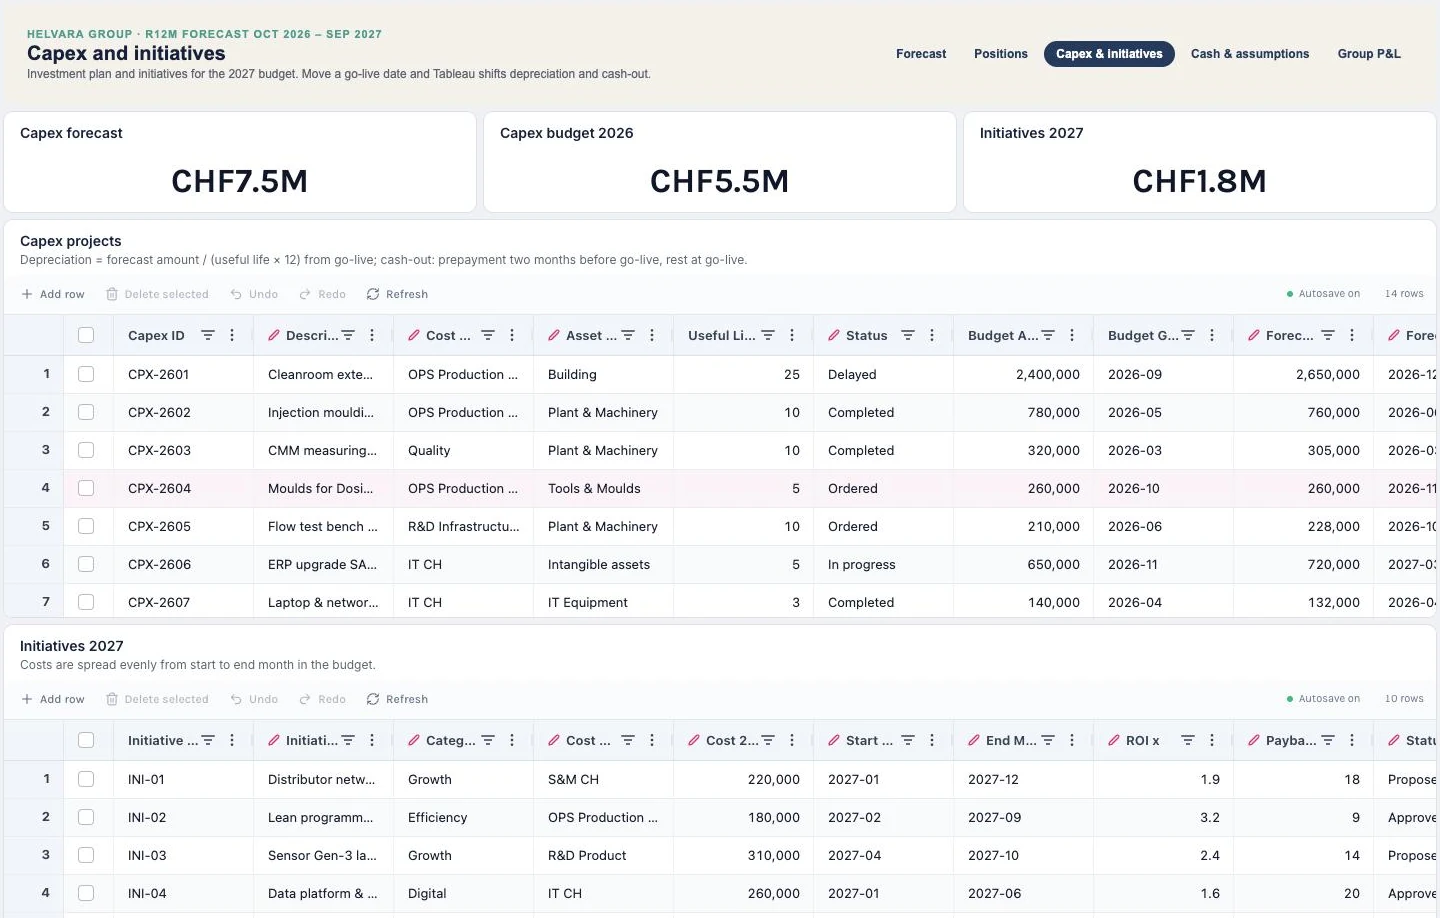
Two spreadsheets: capex projects with budget and forecast amounts and go-live months, and initiatives with cost, start, end, ROI and payback

04

Plan capex and initiatives

Capex projects with budget and forecast amounts and go-live months, and the initiatives for the 2027 budget with cost, timing, ROI and payback. Move a go-live date and depreciation and cash-out move with it.

  • Spreadsheet
  • Writeback
  • KPI visuals
Four tiles: sales CHF 49.9M, EBIT CHF 4.19M, FTE 164.3 and a cash low point of CHF 6.89M

05

Read the group in four numbers

Sales and EBIT for 2026 against budget, the FTE change to Sep 2027 and the lowest month-end cash balance in the forecast.

  • HTML visuals
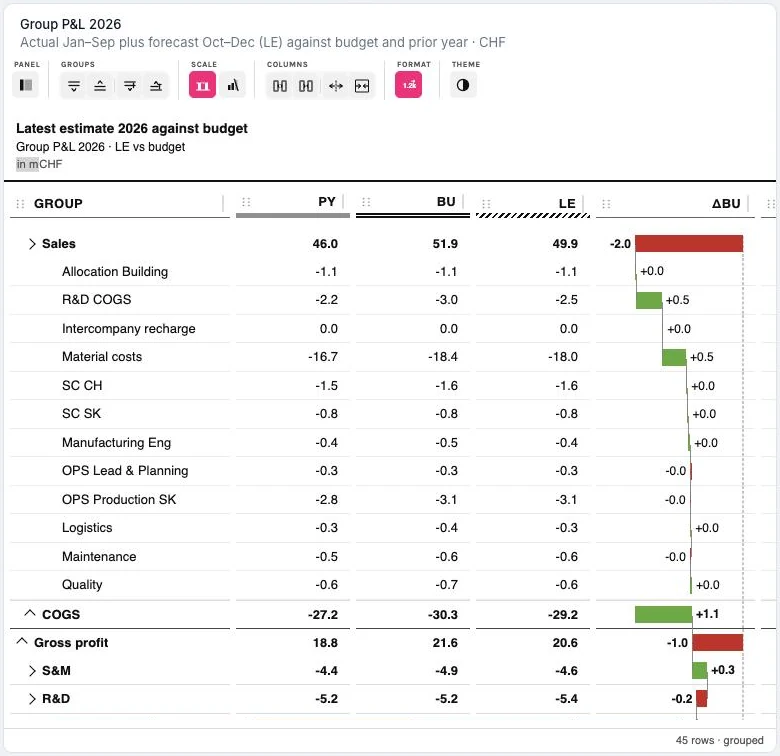
FinanceTables P&L with prior year, budget and latest estimate columns, COGS expanded to its lines, and red and green variance bars

06

Open the P&L

Latest estimate, budget and prior year by P&L section, with subtotals for gross profit, EBIT and net result and variance bars against budget. Expand a section to see its lines.

  • FinanceTables
Line of month-end cash balance and bars of net cash flow per month to Sep 2027

07

Follow the cash

Month-end cash as a line and net cash flow as bars. Receivables, inventory and payables come from rolling averages and days ratios, calculated in Tableau and read live.

  • Bar and line chart
  • Tableau table calculations

How it is wired

Writeback in, Tableau model out.

The input runs on Trulyp writeback tables; the group view reads the same tables through a Tableau model.

  1. Create the input tables

    One writeback table each for P&L lines, positions, capex, initiatives and cash items. The spreadsheet visuals edit them directly.

  2. Lay out one page per input

    Each input page has the same header, owner filters, a grid and a chart or tiles that read from the grid, so owners always see the effect of what they type.

  3. Model the P&L in Tableau

    A published Tableau data source relates the tables and calculates personnel cost, depreciation, the latest estimate and the cash flow. Assumptions such as DSO and DIO are lookups on a table, not parameters.

    MIN([Opening Cash Sep 2026]) + RUNNING_SUM(ZN([CF Net Cash Flow]))
  4. Connect the semantic model

    Trulyp reads the Tableau data source as a semantic model, so the Tableau calculations, including table calculations, arrive ready to use.

  5. Build the group page

    HTML tiles for the headline numbers, FinanceTables for the P&L, and native charts for sales and cash. Header buttons link every page.

Plan on your own numbers.

Collect input in Trulyp, model it where you already do, and report it on the same canvas.